Retirement Spending Smile
“Retirement is the only time in your life when time no longer equals money.” – Unknown
Many people approach retirement planning as if they will spend the same amount every year throughout their retirement. However, spending desires (and needs) change through time. Financial planners typically recommend you should plan on needing 70-80% of your pre-retirement income in retirement. This is because people generally no longer have certain expenses, such as commuting or childcare costs, when they retire. However, keep in mind your expenses could be higher if you still have a mortgage, encounter unforeseen medical expenses, or want to splurge on things like travel when you retire.
Income generate
- The Go-Go Years (age 65-75): The first years of retirement may focus on family, friends, travel, and hobbies. This phase may cost more due to dining out, travel, and social events but these expenses may yield a much greater return on time.d from investments is important. However, retirees should also consider their return on time. Retirement is not a single, consistent block of time. Breaking it down into phases helps you evaluate what a “return on time” really means during the retirement years:
- The Slow-Go Years (age 76-85): These years still may be “go” years but they will likely involve less travel and other costlier expenses. Retirees typically spend less in this phase, sometimes to make up for the higher expenses during the previous decade.
- The No-Go Years (age 86-100): In later years, medic
al costs and other health-related expenses are more likely to increase. During this time, most retirees focus on spending time with family and friends without the expense of travel and expensive hobbies.
What is the Retirement Spending Smile?
David Blanchett’s 2014 article, “Exploring the Retirement Consumption Puzzle” put some data behind these spending patterns by looking at household survey data to track their inflation-adjusted spending through time. Blanchett observed a “retirement spending smile” where changes in real consumption tend to be greater in both early and late retirement.
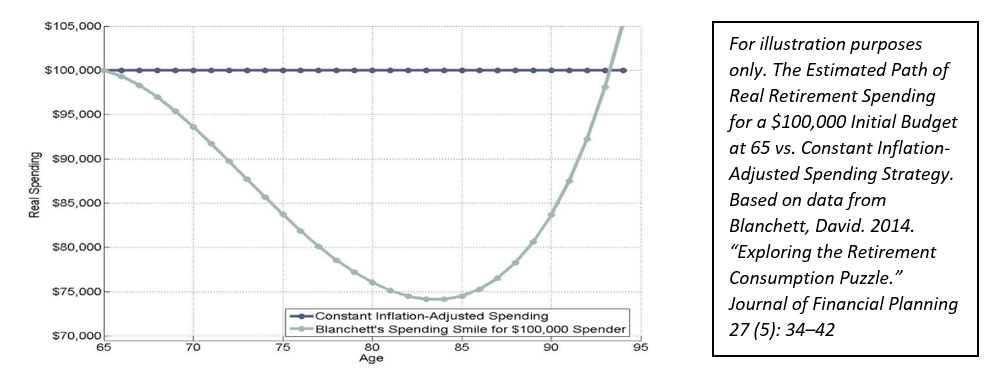
The exhibit, produced by economist Wade Pfau, shows Blanchett’s spending smile for a retiree that begins retirement with expenditures of $100,000. The spending smile reflects the phases of retirement where early retirees spend more as they enjoy traveling and eating out, typically reduce their spending in the middle of retirement, and spend more on healthcare as they continue to age. Further, the research suggests that retiree spending is flexible throughout retirement, especially for higher net worth households.
One category that varies the most between generations and relative needs is spending on healthcare. Based on 2021 data from the U.S. Bureau of Labor Statistics, the Silent generation (born 1945 or earlier) spent 15.8% of their total average spend on healthcare costs. This is higher than the Boomers (born 1946 – 1964) who spent 10.6% of their total expenditures on healthcare costs.
Retirement spending patterns are an important component of deciding on a sustainable spending rate. The Nalls Sherbakoff Group is happy to discuss your expectations for retirement spending as it relates to your portfolio and financial goal plan. We can help you design a tax-efficient withdrawal strategy to prepare you for a successful retirement.